


Written by
Founder & CEO, Gspikes
I own and run Gspikes, the agency I founded in 2018. Before going all-in, I led SEO at Chain Reaction — one of the region's largest digital agencies — and shipped production code at Orange and Forbes. Everything published here comes from projects I've personally built, migrated, or ranked.
Last updated · October 2026
Every Drupal-vs-WordPress article eventually makes a performance claim, and almost none of them bring data. The claims are usually lab tests of two demo sites — one config each, hand-picked themes, n=2. That tells you about those two installs and nothing else.
There is a better instrument. Google’s Chrome UX Report (CrUX) records real-user Core Web Vitals for every website with meaningful Chrome traffic, and the HTTP Archive breaks those measurements out by CMS every month. It is not a sample — it is closer to a census: in July 2026 it covered 92,822 Drupal origins and 2,762,568 WordPress origins on mobile alone. We pulled the full monthly series back to January 2020 — 79 snapshots — and this page is what it says, including the parts that flatter neither platform.
The numbers (July 2026, mobile real-user data)
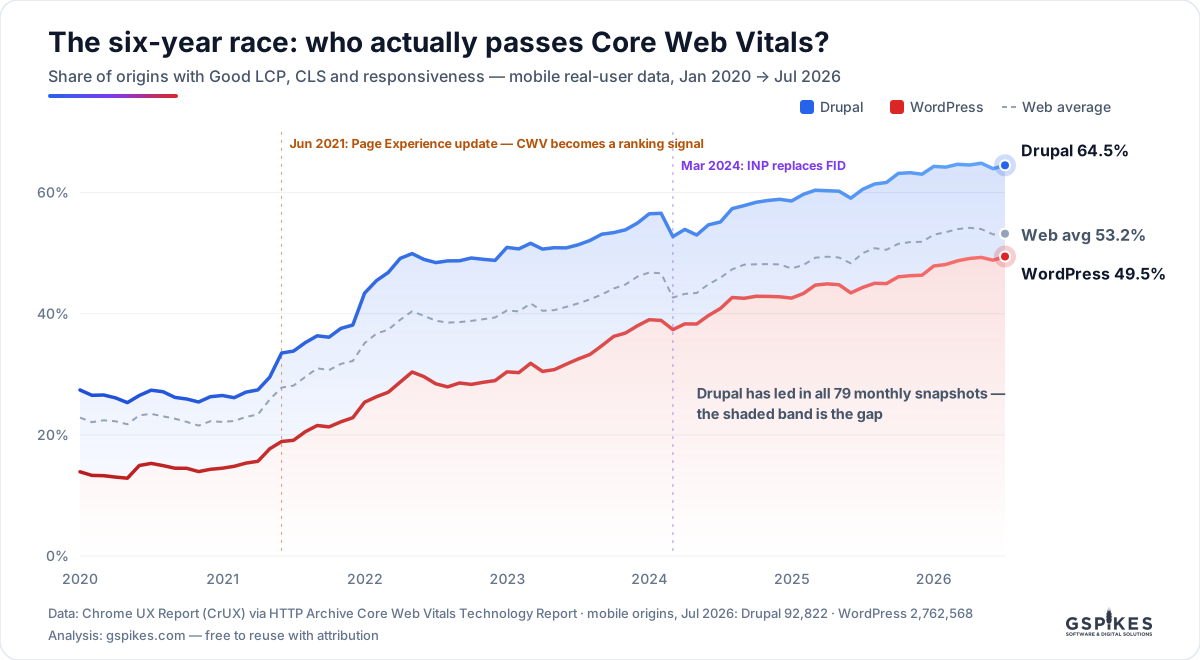
- 64.5% of Drupal sites pass all three Core Web Vitals; 49.5% of WordPress sites do — a 15-point gap (CrUX via HTTP Archive, Jul 2026)
- Drupal has led WordPress in every one of the 79 monthly snapshots since January 2020 — the gap has never been smaller than 11.3 points, never larger than 20.9
- Drupal also beats the whole-web average (53.2%) by 11 points; WordPress trails it by 4
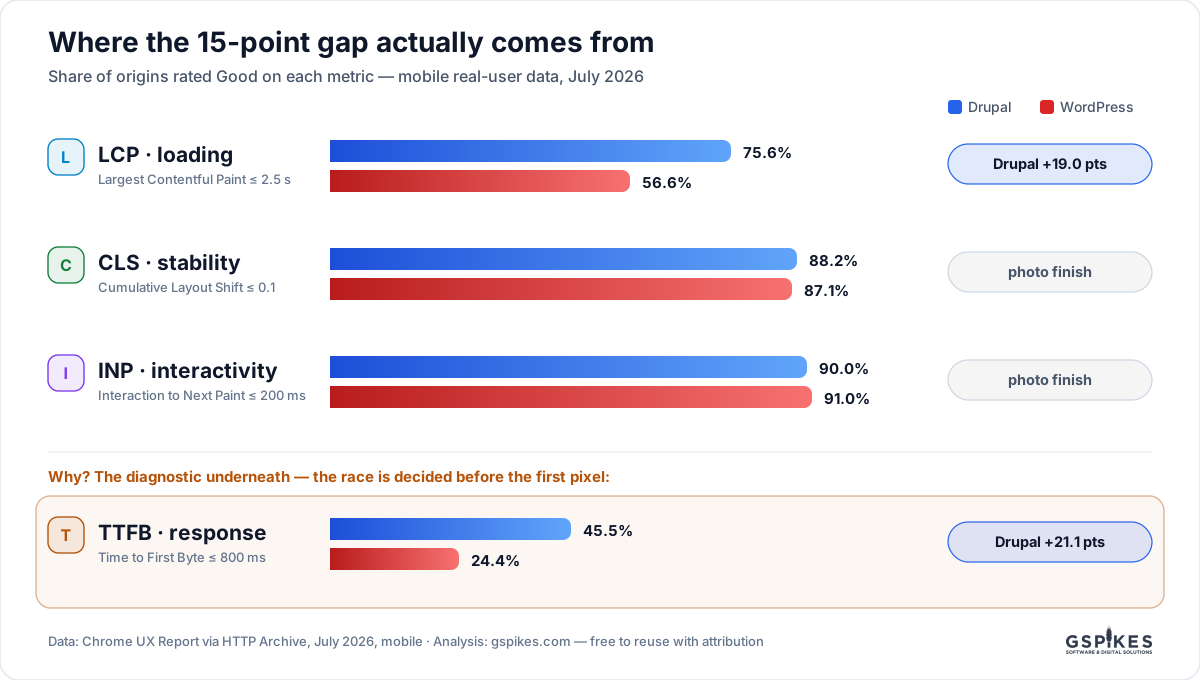
- The gap is loading, not interactivity: LCP 75.6% vs 56.6% (Drupal +19), while CLS (88.2% vs 87.1%) and INP (90.0% vs 91.0%) are photo finishes
- The root cause is server response: 45.5% of Drupal origins have a Good TTFB vs 24.4% of WordPress origins — WordPress sites are roughly half as likely to answer fast
- Both platforms have improved dramatically: Drupal from 27.4% passing in Jan 2020 to 64.5%; WordPress from 13.9% to 49.5% — the whole web got faster; the ranking never changed
- Desktop tells the same story: Drupal 65.0% vs WordPress 53.6%
What Core Web Vitals measure — and which ones actually differ
Core Web Vitals are Google’s three field-measured UX metrics: LCP (Largest Contentful Paint — how fast the main content loads, Good ≤ 2.5 s), CLS (Cumulative Layout Shift — visual stability, Good ≤ 0.1), and INP (Interaction to Next Paint — responsiveness, Good ≤ 200 ms, which replaced FID in March 2024). A site “passes” when all three are Good for at least 75% of real visits. Since the June 2021 Page Experience update they are a confirmed — if modest — ranking signal.
Break the July 2026 pass rates down per metric and the comparison stops being a mystery:
- CLS: 88.2% vs 87.1%. Effectively a tie. Layout stability is a theme-quality problem, and both ecosystems’ modern themes handle it.
- INP: 90.0% vs 91.0%. WordPress is actually a point ahead. Neither platform ships enough JavaScript by default to fail interactivity; if your INP is bad, that’s your page builder or ad stack, not your CMS.
- LCP: 75.6% vs 56.6%. Nineteen points. This is the entire ballgame.
And LCP itself has a confession to make. CrUX also tracks TTFB — Time to First Byte, the pure server-response metric that runs before any front-end work begins. There, 45.5% of Drupal origins are Good against 24.4% of WordPress origins: a 21-point gap, the largest of any metric, sitting underneath the LCP difference. The race is being decided before the first pixel renders.
The honest caveat: this measures fleets, not engines
Here is the part most comparison articles omit. This data cannot prove Drupal’s code is faster than WordPress’s code. CrUX measures deployed websites — fleet against fleet — and the two fleets are not built the same way.
WordPress powers roughly 43% of the web. That fleet contains millions of $5-a-month shared-hosting sites, abandoned blogs, and installs carrying forty plugins nobody audits. Drupal’s ~93,000 measured origins skew heavily toward professionally built, professionally hosted sites — government, universities, enterprises — because that is who chooses Drupal. Some of the gap is selection effect: sites with engineering budgets are faster on any platform.
But that explanation only goes so far, for two reasons. First, the gap survives at the top of the market: HTTP Archive publishes the same comparison filtered to the top-ranked origins, and Drupal’s lead persists among high-traffic sites where both platforms are professionally run. Second, the architecture is not neutral: Drupal core ships render caching, dynamic page caching, and BigPipe by default — a stock Drupal install answers repeat requests from cache before PHP wakes up, while a stock WordPress install runs its full plugin chain on every uncached request and delegates page caching to plugins or hosts. Default-fast beats opt-in-fast at fleet scale, and TTFB is exactly where that shows.
The honest summary: choosing Drupal won’t make a site fast, but the Drupal way of building — cache-first architecture on real hosting — demonstrably does, and the platform pushes you toward it. A well-engineered WordPress site passes CWV comfortably; the data says the average one doesn’t.
What this means if you’re choosing a platform
Core Web Vitals are a modest ranking factor, not a dominant one — content and links still decide most rankings. But they are a conversion factor with no asterisk: slower loading measurably costs revenue on every study ever run. If your shortlist is Drupal vs WordPress for a content-heavy organizational site, the field data says the median outcome on Drupal is a passing site and the median outcome on WordPress is a failing one — with the caveat above that budget, not just platform, drives that. We’ve written before about how this choice plays out for government and higher-ed sites specifically, where the compliance and editorial-workflow arguments stack on top of the performance one.
If you’re staying on WordPress, the same data is a to-do list, and most of it lives below the CMS.
Fixing it: work the stack from the bottom
Every request climbs the same four floors: hosting/edge, server runtime, CMS configuration, front-end. The 21-point TTFB gap lives on the bottom two floors, which means most performance budgets are spent on the wrong end — image optimization can’t rescue a slow first byte.
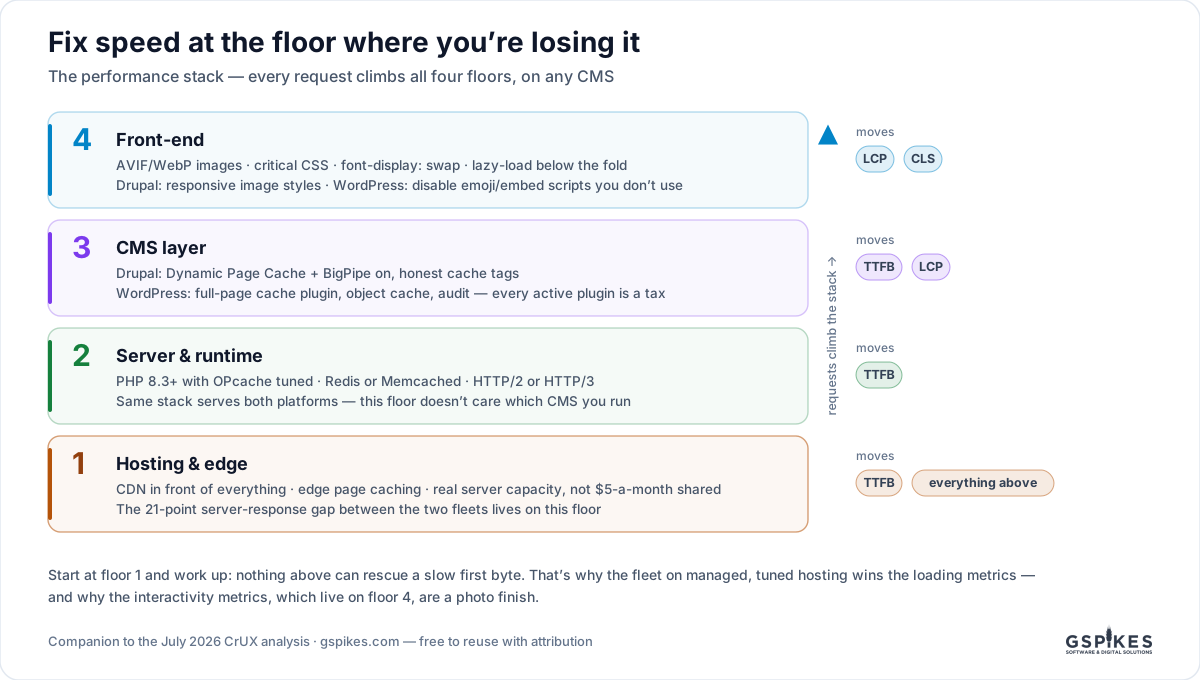
On Drupal, the wins are mostly about not defeating what core gives you: keep Dynamic Page Cache and BigPipe enabled, keep cache tags honest in custom code (we’ve covered the render-cache discipline in our Drupal SEO guide), put a CDN in front, and size hosting for your actual traffic — our Drupal hosting guide walks through what that costs at each tier. A Drupal site with a bad TTFB almost always has a cache being bypassed by one bad module or an undersized origin server.
On WordPress, the leverage order is: real hosting with server-level page caching, a full-page cache plugin configured to actually hit, an object cache (Redis), PHP 8.3+, and then a genuine plugin audit — every active plugin runs on every uncached request, and the fleet’s 24.4% TTFB pass rate is substantially a plugin-count problem. Front-end work (AVIF images, critical CSS, font loading) comes after the first byte is fast, not instead of it.
Methodology — check our work
- Source: Chrome UX Report field data, aggregated monthly by the HTTP Archive Core Web Vitals Technology Report, queried via its public API for the technologies “WordPress”, “Drupal”, and the all-web baseline, January 2020 through July 2026 (79 monthly snapshots).
- Metric: share of origins where all three Core Web Vitals are Good for ≥75% of visits (“passes CWV”), mobile unless stated. Before March 2024 the responsiveness metric was FID; CrUX switched to the stricter INP — the series is continuous but the definition changed at that annotated point.
- Scale: July 2026 mobile origins measured: Drupal 92,822 · WordPress 2,762,568 · all web 8,710,147. “2.9 million sites” in the title is the two platforms’ combined mobile origins in that single month.
- Known biases: CrUX only includes sites with sufficient Chrome traffic (survivor bias toward sites people actually visit); CMS detection is Wappalyzer-based and misses heavily customized or fully headless builds; and fleet composition differs as discussed above. We report the fleet difference and attribute causes cautiously.
- Percentages are computed from the API’s raw good/tested origin counts, not read off dashboards. The pull is reproducible from the public endpoint.
All three graphics and every number here are free to reuse with attribution and a link to this page. Like our Drupal 7 census, this page gets refreshed quarterly as new CrUX months land — next update: November 2026, alongside the census.
Gspikes is a Drupal development and SEO agency; performance-safe Drupal builds and migrations are our flagship service. That’s both the disclosure and the reason we read CrUX data for fun.
Field Notes
Get the next one by email
Research on Drupal, WordPress and search. Measured, not guessed. New pieces straight to your inbox.
Put senior Drupal engineers on it
Migrations, custom modules, integrations, and support with real SLAs — with a fixed-price quote from a senior engineer within 3 days.